Language guide, engine API, 601 builtins and the preset library · v3.0.0-phase1
Performance
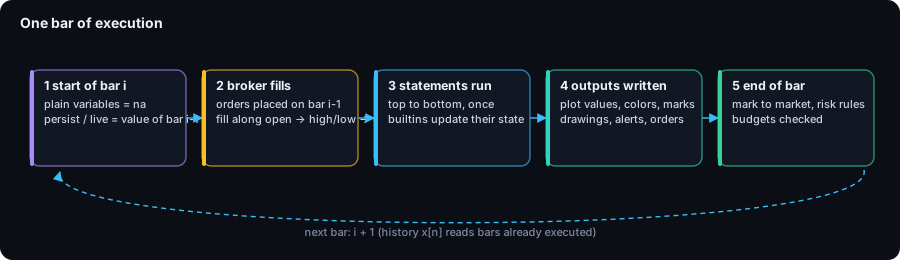
The engine compiles a script once and then runs a tight loop over the bars: every builtin is a C++ kernel with its state kept per call site, series live in flat column arrays, and nothing is allocated per bar on the hot path. This chapter shows what that costs in practice, where the time goes, and how to keep a large script fast.
The bar loop
Measured numbers
All numbers below were measured on an Apple M4 with tests/perf/million.py (synthetic one-minute bars, release build). Run it on your own machine with:
quas bench runs the script without exporting anything. The cost per bar does not grow with the length of the data: 1 M, 5 M and 10 M bars give the same nanoseconds per bar.
In other words: a typical analysis processes one million bars in 30 – 100 ms; the heaviest presets, which walk lists of zones or windows on every bar, take about one second.
Full runs with output
quas run --keep-series also keeps every output value of every bar, and the JSON writer exports them. At one million bars:
Script
Run ms
JSON export ms
JSON MB
volume/obv
13
21
8.6
trend/supertrend
65
110
46.9
momentum/macd
82
125
52
trend/ichimoku_cloud
101
208
62.7
strategy/trend_breakout_atr
126
188
55.3
charts/candlesticks_and_bars (7 outputs)
80
382
125
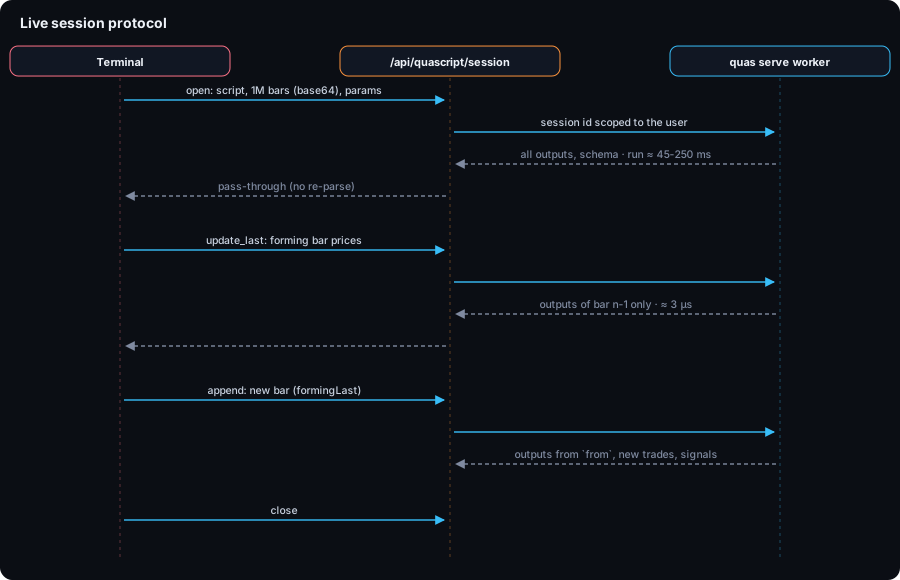
Exporting text costs more than computing. The serve protocol therefore sends columns as little-endian float64 in base64 (encoding: "base64"), and the terminal only asks for the visible range (view).
Live sessions
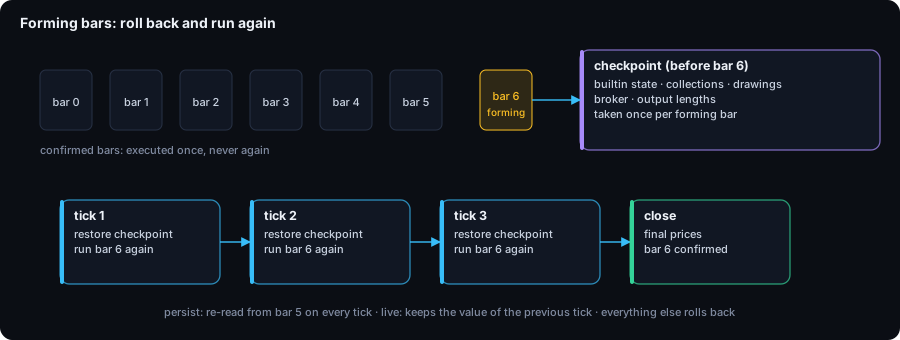
quas serve keeps a session per chart. A tick re-runs only the forming bar from a checkpoint taken when that bar opened; a new bar runs one bar.
The forming bar
Measured over one million bars, 2000 ticks with a new bar every ten:
Script
Open (parse / run ms)
Tick, engine p50 / p99 µs
Tick, round trip p50 µs
New bar, engine p50 µs
ma/sma
38 / 49
1.6 / 10.4
14
3.6
momentum/macd
38 / 93
2.0 / 6.5
15
4.1
volume/vwap
34 / 60
1.9 / 2.8
15
3.8
trend/ichimoku_cloud
34 / 109
1.8 / 3.8
14
4.3
momentum/momentum_matrix
33 / 240
6.8 / 9.6
21
10.5
strategy/trend_breakout_atr
32 / 125
5.9 / 8.3
19
7.7
bot/ema_cross_bot
32 / 64
6.0 / 10.1
20
7.7
volume/session_volume_profile
34 / 395
23.5 / 34.2
38
25.7
smc/market_structure_zones
34 / 806
3.6 / 197
17
43.3
A tick costs a few microseconds of engine time; the round trip through the pipe and JSON is 15 – 40 µs. The p99 of market_structure_zones is a tick on which a zone is created or mitigated, so the drawings are sent again.
The session protocol
Chart rendering
The terminal's chart library draws one million candles with setData in 37 ms, the first frame in 93 ms (WebGL) or 226 ms (canvas), and pans in about 2 ms per frame. Outputs whose color changes per bar use the canvas renderer.
Where the time goes
Approximate costs, derived from the benchmarks above:
Cost
Typical
Notes
A builtin call (ta.ema, ta.rsi)
3 – 10 ns
O(1) per bar: running sums, Wilder smoothing, monotonic deques for highest / lowest
A window statistic (stat.stdev, stat.linreg)
5 – 15 ns
rolling sums, O(1) per bar
stat.percentile, stat.percent_rank, stat.mode
20 – 60 ns
a sorted window, O(log n) insert and remove
stat.hurst, stat.entropy, stat.fractal_dim
100 – 800 ns
O(window) per bar
A history read (close[5])
~1 ns
ring buffers sized by the compiler from the largest offset
A while loop over a list
per element
each iteration is interpreted; bound the list
Creating a drawing
~100 ns
objects are capped by max_objects
A per-bar color
~2 ns
constant colors are folded at compile time
Keeping scripts fast
Prefer builtins to loops.ta.highest(high, 50) is O(1) per bar; a for loop over the last 50 bars is 50 interpreted iterations.
Bound what grows. Shift old elements out of lists (if list.size(zones) > 30 { list.shift(zones) }) and keep max_objects as small as the chart needs.
Write on the last bar. Fill tables and labels inside if bar.is_last; the values are computed on every bar anyway.
Use constant arguments. Colors, lengths and strings that are constants are folded by the compiler; param.* values are constants too.
Pick the right statistic.stat.stdev is O(1); stat.percentile is O(log n); stat.hurst is O(n) per bar. Use the heavy ones with short windows, or on a higher interval with feed.series.
Avoid exporting what you do not draw. Every render.* call is an output that the terminal receives; compute helper values without rendering them.
Measure.quas bench script.qs --synth 1000000 gives the cost per bar. To find the expensive part, comment out half of the script and bench again; quas check --dis shows the compiled instructions and how many kernel states the script holds.
Limits that protect the host
Limit
Value
Instructions per run
the larger of 2 × 10⁹ and 4000 per bar
Drawing objects per kind
max_objects, default 500, at most 2000
On-screen table size
100 rows × 20 columns
Libraries per program
16, nested at most 4 levels
Serve request size
1 GiB
HTTP route
2 000 000 bars per request
A script that exceeds a limit stops with LIMIT_EXCEEDED (naming the limit: instructions, loop, memory or collection) instead of blocking the worker.