
QuaScript Documentation
Language guide, engine API, 601 builtins and the preset library · v3.0.0-phase1
Chart styles by example
Every output the engine can draw, one short script each. Each chart on this page is the real result of the script above it, run by the engine on synthetic one-minute bars: drag to pan, scroll to zoom, hover for values and click a legend entry to hide a series. Copy any of them into the editor as a starting point.
Lines
Line, spline and step
analysis "Line, spline, step" { overlay = true }

render.line(ta.ema(close, 12), "EMA 12 (line)", color = color.sky.400, width = 2)
render.spline(ta.sma(close, 30), "SMA 30 (spline)", color = color.violet.400, width = 2)
render.step(ta.highest(high, 40), "40-bar high (step)", color = color.emerald.400)
render.step(ta.lowest(low, 40), "40-bar low (step)", color = color.rose.400)Dashed and dotted strokes
analysis "Strokes" { overlay = true }

(mid, up, dn) = ta.keltner(close, 20, 1.5, 10)
render.line(mid, "Mid", color = color.amber.400, width = 2)
render.line(up, "Upper", color = color.amber.300, stroke = style.dashed)
render.line(dn, "Lower", color = color.amber.300, stroke = style.dotted)A line that changes color
When color is an expression, every bar gets its own color and the line changes color segment by segment.
analysis "Slope colored" { overlay = true }

h = ta.hull(close, 34)
render.line(h, "Hull 34", color = h > h[1] ? color.emerald.400 : color.rose.400, width = 3)Offset lines
offset shifts a line by whole bars; positive values move it right (into the future).
analysis "Displaced moving average" { overlay = true }

m = ta.sma(close, 20)
render.line(m, "SMA 20", color = color.slate.400)
render.line(m, "SMA 20, +10 bars", color = color.cyan.400, offset = 10, width = 2)
render.line(m, "SMA 20, -10 bars", color = color.fuchsia.400, offset = -10, stroke = style.dashed)Areas, histograms and baselines
Histogram with four colors
analysis "MACD histogram" { overlay = false }

(line, signal, hist) = ta.macd(close, 12, 26, 9)
rising = hist > hist[1]
c = hist >= 0 ? (rising ? color.teal.400 : color.teal.700) : (rising ? color.rose.700 : color.rose.400)
render.histogram(hist, "Histogram", color = c)
render.line(line, "MACD", color = color.sky.400)
render.line(signal, "Signal", color = color.orange.400)
render.level(0, "Zero", color = color.slate.600)Area
analysis "Area" { overlay = false }

r = ta.roc(close, 20)
render.area(r, "ROC 20", base = 0, color = color.translucent(color.indigo.400, 30))
render.level(0, "Zero", color = color.slate.500)Stepped area
analysis "Stepped area" { overlay = false }

up = ta.rising(close, 3) ? 1 : 0
render.stepped_area(stat.sum(up, 20), "Rising bars in 20", base = 0, color = color.translucent(color.lime.500, 40))Baseline
analysis "Distance from VWAP" { overlay = false }

(vw, _, _) = ta.vwap(close)
d = (close - vw) / vw * 100
render.baseline(d, "Distance %", base = 0, up_color = color.emerald.400, down_color = color.rose.400, width = 2)Shapes
Dots on swing points
analysis "Swing dots" { overlay = true }

render.dots(ta.pivot_high(6, 6), "Swing high", shape = shape.triangle_down, size = 4, color = color.rose.400, offset = -6)
render.dots(ta.pivot_low(6, 6), "Swing low", shape = shape.triangle_up, size = 4, color = color.emerald.400, offset = -6)The pivot is confirmed six bars after it happens; offset = -6 draws the dot on the pivot bar itself. Use the offset for display only: on the live bar the value is still six bars late.
A dot trail
analysis "Parabolic SAR" { overlay = true }

s = ta.psar(0.02, 0.02, 0.2)
render.dots(s, "PSAR", shape = shape.circle, size = 2, color = s < close ? color.emerald.400 : color.rose.400)Every mark shape
analysis "Mark shapes" { overlay = true }

k = bar.index % 40
render.mark(k == 0, shape = shape.arrow_up, at = anchor.below_bar, color = color.red.400, text = "arrow_up")
render.mark(k == 5, shape = shape.arrow_down, at = anchor.above_bar, color = color.orange.400, text = "arrow_down")
render.mark(k == 10, shape = shape.circle, at = anchor.below_bar, color = color.amber.400, text = "circle")
render.mark(k == 15, shape = shape.diamond, at = anchor.above_bar, color = color.lime.400, text = "diamond")
render.mark(k == 20, shape = shape.square, at = anchor.below_bar, color = color.emerald.400, text = "square")
render.mark(k == 25, shape = shape.star, at = anchor.above_bar, color = color.cyan.400, text = "star")
render.mark(k == 30, shape = shape.triangle_up, at = anchor.below_bar, color = color.blue.400, text = "triangle_up")
render.mark(k == 35, shape = shape.cross, at = anchor.above_bar, color = color.violet.400, text = "cross")Marks at a price
analysis "Breakout marks" { overlay = true }

hh = ta.highest(high, 30)
ll = ta.lowest(low, 30)
hi = hh[1]
lo = ll[1]
render.step(hi, "30-bar high", color = color.slate.500)
render.step(lo, "30-bar low", color = color.slate.500)
render.mark(ta.cross_up(close, hi), shape = shape.diamond, at = anchor.price, price = hi, color = color.emerald.400, size = 1.4)
render.mark(ta.cross_down(close, lo), shape = shape.diamond, at = anchor.price, price = lo, color = color.rose.400, size = 1.4)Bands and fills
Flat band
analysis "Donchian channel" { overlay = true }

(mid, up, dn) = ta.donchian(30)
pu = render.line(up, "Upper", color = color.sky.500)
pd = render.line(dn, "Lower", color = color.sky.500)
render.line(mid, "Mid", color = color.sky.300, stroke = style.dotted)
render.band(pu, pd, color = color.sky.500, opacity = 0.08)Gradient band
analysis "Gradient Bollinger" { overlay = true }

(mid, up, dn) = ta.bollinger(close, 20, 2.0)
pu = render.line(up, "Upper", color = color.rose.400)
pm = render.line(mid, "Basis", color = color.slate.400)
pd = render.line(dn, "Lower", color = color.emerald.400)
render.band(pu, pm, texture = "gradient", upper_color = color.rose.500, lower_color = color.slate.500, opacity = 0.25)
render.band(pm, pd, texture = "gradient", upper_color = color.slate.500, lower_color = color.emerald.500, opacity = 0.25)Cloud
analysis "Ichimoku cloud" { overlay = true }

(conv, base, a, b, lag) = ta.ichimoku()
render.line(conv, "Conversion", color = color.sky.400)
render.line(base, "Base", color = color.orange.400)
pa = render.line(a, "Span A", color = color.emerald.500, offset = 26)
pb = render.line(b, "Span B", color = color.rose.500, offset = 26)
render.band(pa, pb, texture = "cloud", upper_color = color.emerald.500, lower_color = color.rose.500, opacity = 0.22)Fill between a line and a level
analysis "RSI zones" { overlay = false }

r = ta.rsi(close, 14)
pr = render.line(r, "RSI", color = color.violet.400, width = 2)
ob = render.level(70, "70", color = color.rose.500, stroke = style.dashed)
os = render.level(30, "30", color = color.emerald.500, stroke = style.dashed)
render.band(ob, os, color = color.violet.500, opacity = 0.06)
mid = render.level(50, "50", color = color.slate.600, stroke = style.dotted)
render.band(pr, mid, color = color.violet.400, opacity = 0.12)Backgrounds, candles and time marks
Background by regime
analysis "Trend regime" { overlay = true }

(adx, plus, minus) = ta.adx(14, 14)
trending = adx > 25
render.background(trending ? (plus > minus ? color.translucent(color.emerald.500, 88) : color.translucent(color.rose.500, 88)) : na)
render.line(ta.ema(close, 50), "EMA 50", color = color.slate.300)Candle colors
analysis "Momentum candles" { overlay = true }

r = ta.rsi(close, 14)
render.candle_color(color.gradient(r, 25, 75, color.rose.500, color.emerald.400))Time marks
analysis "Hour marks" { overlay = true }

render.time_mark(time.minute() == 0 and time.hour() % 2 == 0, "Every 2 hours", color = color.amber.500)
render.line(ta.vwma(close, 30), "VWMA 30", color = color.cyan.400)Price styles
Heikin-Ashi
analysis "Heikin-Ashi" { overlay = false }

render.price.heikin(up_color = color.teal.400, down_color = color.rose.400)Candles computed by the script
analysis "Smoothed candles" { overlay = false }

o = ta.ema(open, 5)
c = ta.ema(close, 5)
h = math.max(ta.ema(high, 5), math.max(o, c))
l = math.min(ta.ema(low, 5), math.min(o, c))
render.price.candles(o = o, h = h, l = l, c = c, up_color = color.sky.400, down_color = color.orange.400)OHLC bars
analysis "OHLC bars" { overlay = false }

render.price.bars(up_color = color.lime.400, down_color = color.pink.400)Profiles
analysis "Visible range profile" { overlay = true }

render.profile.volume(rows = 48, value_area = 0.7, width = 150, up_color = color.teal.500, down_color = color.rose.500, poc_color = color.amber.400)analysis "Developing value area" { overlay = true }
(poc, vah, val) = ta.volume_profile(40, 0.7)
render.step(poc, "POC", color = color.amber.400, width = 2)
pv = render.step(vah, "VAH", color = color.sky.500)
pl = render.step(val, "VAL", color = color.sky.500)
render.band(pv, pl, color = color.sky.500, opacity = 0.07)Drawings
Segments and tags
analysis "Swing segments" { overlay = true, max_objects = 60 }

ph = ta.pivot_high(8, 8)
pl = ta.pivot_low(8, 8)
persist last_x = na
persist last_y = na
if not math.is_na(ph) {
    if not math.is_na(last_y) { draw.segment.create(last_x, last_y, bar.index - 8, ph, color = color.emerald.400, width = 2) }
    draw.tag.create(bar.index - 8, ph, str.format("{:.2f}", ph), shape = shape.tag_down, color = color.emerald.700)
    last_x := bar.index - 8
    last_y := ph
}
if not math.is_na(pl) {
    if not math.is_na(last_y) { draw.segment.create(last_x, last_y, bar.index - 8, pl, color = color.rose.400, width = 2) }
    draw.tag.create(bar.index - 8, pl, str.format("{:.2f}", pl), shape = shape.tag_up, color = color.rose.700)
    last_x := bar.index - 8
    last_y := pl
}Zones that extend to the right
analysis "Range boxes" { overlay = true, max_objects = 40 }

k = bar.index % 60
persist id = na
persist top = na
persist bot = na
if k == 0 {
    top := high
    bot := low
    id := draw.zone.create(bar.index, top, bar.index + 1, bot, color = color.translucent(color.indigo.500, 82), border_color = color.indigo.400)
} else {
    top := math.max(top, high)
    bot := math.min(bot, low)
    draw.zone.update(id, top = top, bottom = bot, right = bar.index)
}A dashboard table
analysis "Market dashboard" { overlay = true }

r = ta.rsi(close, 14)
(adx, _, _) = ta.adx(14, 14)
v = ta.historical_vol(close, 30, 365 * 24 * 60)
trend = close > ta.ema(close, 100)
persist t = draw.table.create(anchor.top_right, 4, 2)
if bar.is_last {
    draw.table.cell(t, 0, 0, "RSI 14", text_color = color.slate.400)
    draw.table.cell(t, 0, 1, str.format("{:.1f}", r), bg_color = r > 70 ? color.rose.800 : r < 30 ? color.emerald.800 : na)
    draw.table.cell(t, 1, 0, "ADX 14", text_color = color.slate.400)
    draw.table.cell(t, 1, 1, str.format("{:.1f}", adx))
    draw.table.cell(t, 2, 0, "Vol 30", text_color = color.slate.400)
    draw.table.cell(t, 2, 1, str.format("{:.0f}%", v))
    draw.table.cell(t, 3, 0, "Trend", text_color = color.slate.400)
    draw.table.cell(t, 3, 1, trend ? "Up" : "Down", bg_color = trend ? color.emerald.700 : color.rose.700)
}Multi-pane layouts
analysis "Price, RSI and volume" { overlay = true }

render.line(ta.ema(close, 21), "EMA 21", color = color.sky.400)
render.line(ta.rsi(close, 14), "RSI", color = color.violet.400, pane = 1)
render.level(50, "RSI 50", color = color.slate.600, pane = 1)
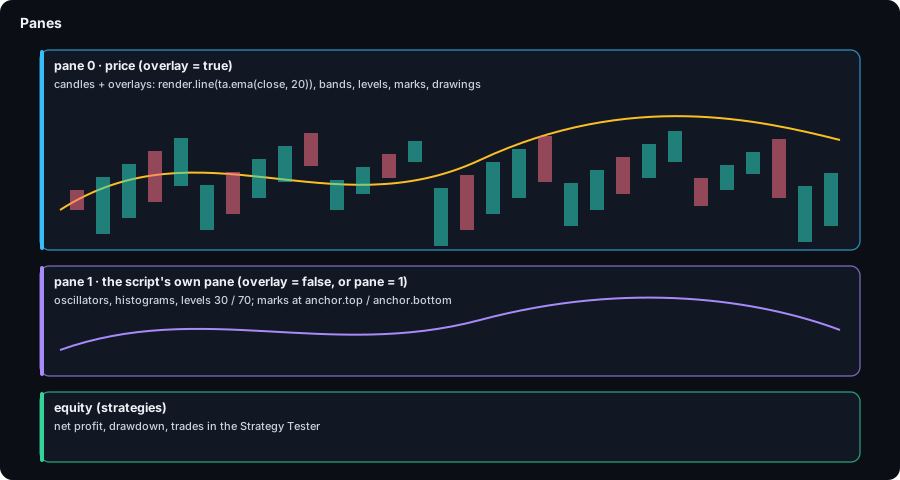
render.histogram(volume, "Volume", color = close >= open ? color.translucent(color.teal.500, 40) : color.translucent(color.rose.500, 40), pane = 2)pane = 0 is the price pane; pane = 1, 2 … are lower panes in the order you use them.
Rainbows
A rainbow ribbon
A constant loop unrolls into one call site per element, so each moving average keeps its own state. color.hsv turns the length into a hue.
analysis "Rainbow ribbon" { overlay = true }

for len in [10, 15, 20, 25, 30, 35, 40, 45, 50, 55, 60] {
    render.line(ta.ema(close, len), "EMA " + str.of(len), color = color.hsv((len - 10) * 6, 80, 95), width = 2)
}Rainbow by value
analysis "Hue by RSI" { overlay = false }

r = ta.rsi(close, 14)
render.histogram(r - 50, "RSI - 50", color = color.hsv(math.clamp(r, 0, 100) * 2.6, 75, 95))
render.line(ta.ema(r - 50, 9), "Smoothed", color = color.white, width = 2)Spectrum heat candles
analysis "Spectrum candles" { overlay = true }

z = stat.zscore(close, 50)
render.candle_color(color.hsv(math.clamp((z + 2.5) / 5, 0, 1) * 270, 85, 95))
render.line(ta.sma(close, 50), "SMA 50", color = color.slate.300)