
QuaScript Documentation
Language guide, engine API, 601 builtins and the preset library · v3.0.0-phase1
Colors
The palette
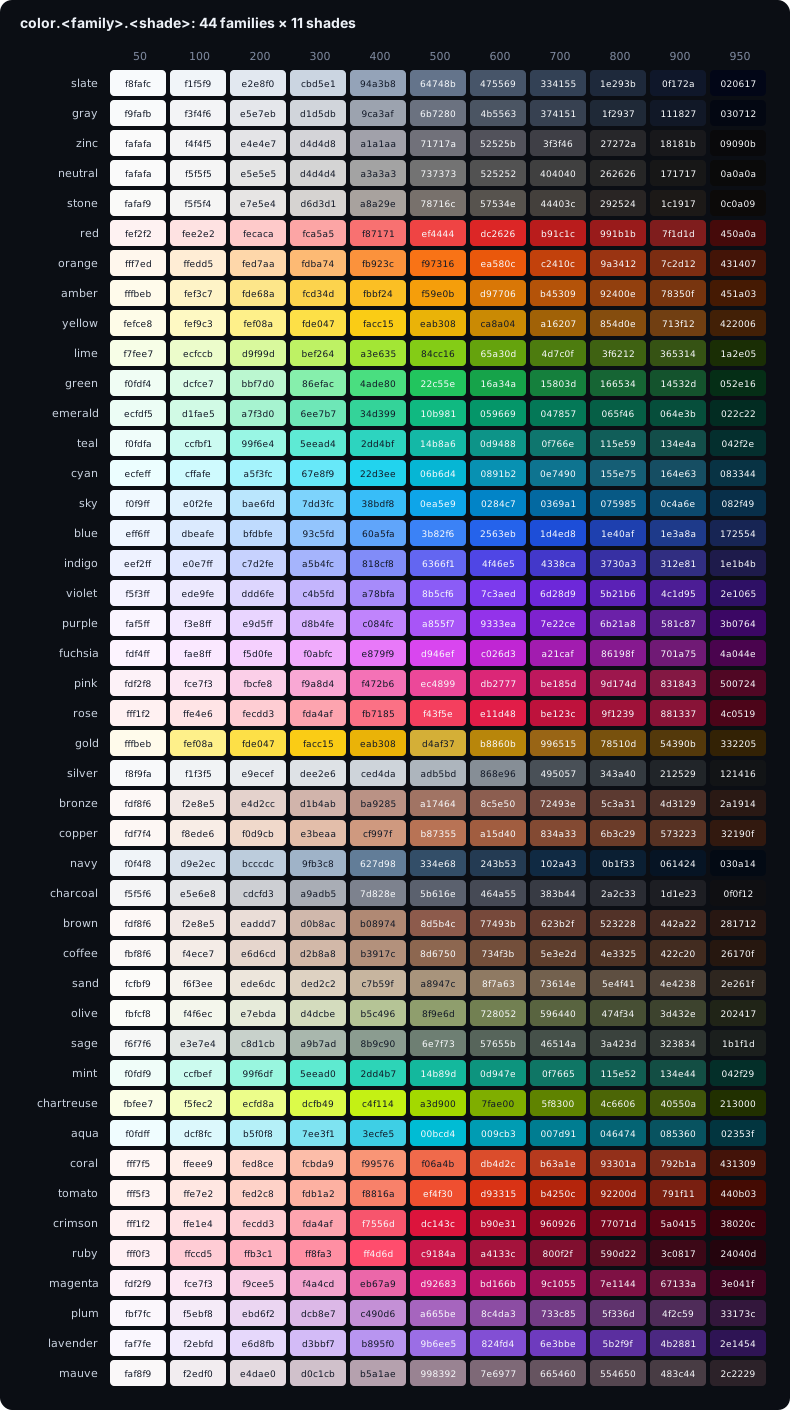
color.<family>.<shade> names 44 families with 11 shades each: 50, 100, 200 … 900, 950 (light to dark). Families include slate gray zinc neutral stone red orange amber yellow lime green emerald teal cyan sky blue indigo violet purple fuchsia pink rose and more. color.black, color.white and color.transparent are also defined. Hex literals #rrggbb work anywhere a color does.
The explorer below lists every family in rainbow order, with the neutral families last. Select a swatch (or use the arrow keys) to see its values, its contrast on dark and light backgrounds and its translucent variants. Switch "Click sets" to B (or shift-click) to pick a second color and build a gradient between the two; the example script under the explorer uses both.
color.translucent(c, t), 0 = opaque)analysis "Palette: sky" { overlay = false }
m = ta.rsi(close, 14) - 50
heat = color.gradient(m, -20, 20, color.rose.500, color.sky.400)
render.histogram(m, "Momentum", color = heat)
render.line(ta.ema(m, 9), "Signal", color = color.sky.400, width = 2)
render.area(m, "Area", base = 0, color = color.translucent(color.sky.400, 85))analysis "Rainbow ribbon" { overlay = true }
// one moving average per family, in rainbow order
render.line(ta.ema(close, 8), "EMA 8", color = color.red.400)
render.line(ta.ema(close, 14), "EMA 14", color = color.coral.400)
render.line(ta.ema(close, 20), "EMA 20", color = color.bronze.400)
render.line(ta.ema(close, 26), "EMA 26", color = color.coffee.400)
render.line(ta.ema(close, 32), "EMA 32", color = color.sand.400)
render.line(ta.ema(close, 38), "EMA 38", color = color.yellow.400)
render.line(ta.ema(close, 44), "EMA 44", color = color.chartreuse.400)
render.line(ta.ema(close, 50), "EMA 50", color = color.lime.400)analysis "Palette" { overlay = true }
render.line(ta.ema(close, 9), "Fast", color = color.sky.400, width = 2)
render.line(ta.ema(close, 21), "Mid", color = color.amber.500, width = 2)
render.line(ta.ema(close, 50), "Slow", color = #8b5cf6, width = 2)Choosing shades
| Shade | Use it for |
|---|---|
| 50 – 200 | text and thin lines on dark backgrounds; fills on light ones |
| 300 – 500 | the main lines and marks: readable on both themes |
| 600 – 800 | histogram columns, candle colors, table cell backgrounds |
| 900 – 950 | backgrounds and panels; fills on dark themes |
A pair from the same family (teal.400 line, teal.800 fill) always looks related. For up / down pairs, keep the shade equal (emerald.500 / rose.500) so neither side looks louder.
Color functions
| Function | Result |
|---|---|
color.rgb(r, g, b, transparency = 0) | a color from channels 0 .. 255 |
color.translucent(c, transparency) | c with 0 (opaque) .. 100 (invisible) transparency |
color.gradient(x, lo, hi, c1, c2) | c1 at lo blending to c2 at hi (also a two-color mix: color.gradient(t, 0, 1, a, b)) |
color.lighten(c, amount) / color.darken(c, amount) | lighter / darker by 0 .. 100 |
color.hsv(h, s, v) | from hue 0 .. 360, saturation and value 0 .. 100 |
color.complement(c) / color.invert(c) / color.grayscale(c) | |
color.harmonics(c, scheme) | a harmonic partner of c |
color.contrast(a, b) | WCAG contrast ratio of two colors |
color.readable(c) | black or white, whichever reads better on c |
color.alpha(c) | the transparency of c |
color.ramp(x, min, max, palette = "viridis", transparency = 0) | x on a multi-stop palette, from its first stop at min to its last at max |
Multi-stop palettes
color.ramp maps a value onto a palette with many stops, which reads far better on heatmaps than a two-color blend. Swap min and max to reverse a palette.
| Palette | Kind | Use it for |
|---|---|---|
viridis, cividis | sequential, perceptually uniform | any 0 .. high quantity; cividis is safe for color-blind readers |
magma, inferno, plasma | sequential, dark to bright | intensity, power, heat, volatility |
turbo | rainbow, high contrast | dense heatmaps where fine steps matter |
spectral, coolwarm | diverging | signed values around a centre (z-scores, correlation) |
terrain | sequential | smooth (low) to rough (high), e.g. fractal dimension |
pnl | diverging, dark centre | gains and losses |
analysis "Ramp palettes" { overlay = false }

z = stat.zscore(close, 50)
render.histogram(z, "Z-score", color = color.ramp(z, -2.5, 2.5, "coolwarm"))
render.line(ta.rsi(close, 14) / 25 - 2, "RSI scaled", color = color.ramp(ta.rsi(close, 14), 20, 80, "plasma"), width = 2)viridis, magma, inferno, plasma and cividis are CC0 (van der Walt, Smith and Nunez); turbo is Apache-2.0 (Mikhailov, Google); spectral comes from ColorBrewer and coolwarm from Moreland (2009).
Calls with constant arguments are folded at compile time, so color.translucent(color.red.500, 80) costs nothing per bar. A color that depends on the bar (an expression with close, an if, a gradient over a series) is computed per bar and drawn per bar.
Transparency
analysis "Transparency steps" { overlay = true }

m = ta.sma(close, 40)
s = ta.atr(40)
for k in [1, 2, 3] {
    pu = render.line(m + k * s, "Upper " + str.of(k), color = color.translucent(color.cyan.400, 20 * k))
    pd = render.line(m - k * s, "Lower " + str.of(k), color = color.translucent(color.cyan.400, 20 * k))
    render.band(pu, pd, color = color.cyan.500, opacity = 0.05)
}
render.line(m, "SMA 40", color = color.cyan.300, width = 2)Transparency is 0 (opaque) to 100 (invisible). Stacked translucent bands add up: three bands at 5 % opacity give a darker core and lighter edges.
Heat maps
analysis "RSI heat" { overlay = false }

r = ta.rsi(close, 14)
heat = r >= 50 ? color.gradient(r, 50, 100, color.slate.400, color.rose.500) : color.gradient(r, 0, 50, color.sky.500, color.slate.400)
render.line(r, "RSI", color = heat, width = 2)Two gradients joined at the midpoint give a diverging scale: cool below 50, neutral at 50, warm above. The same idea works for any oscillator with a natural center.
Three-stop gradients
analysis "Three-stop heat" { overlay = false }

z = stat.zscore(close, 60)
c = z < 0 ? color.gradient(z, -2.5, 0, color.blue.500, color.amber.300) : color.gradient(z, 0, 2.5, color.amber.300, color.red.500)
render.histogram(z, "Z-score", color = c)
render.level(2, "+2", color = color.red.700, stroke = style.dashed)
render.level(-2, "-2", color = color.blue.700, stroke = style.dashed)Gradient by volume
analysis "Relative volume heat" { overlay = false }

rv = volume / ta.sma(volume, 50)
render.histogram(volume, "Volume", color = color.gradient(rv, 0.5, 3, color.slate.700, color.yellow.300))
render.line(ta.sma(volume, 50), "Average", color = color.slate.400)Rainbows
color.hsv(h, s, v) walks the color wheel: 0 is red, 60 yellow, 120 green, 180 cyan, 240 blue, 300 magenta. Mapping a value to the hue gives a rainbow scale.
analysis "Rainbow Bollinger" { overlay = true }

basis = ta.sma(close, 30)
dev = stat.stdev(close, 30)
for k in [0.5, 1.0, 1.5, 2.0, 2.5, 3.0] {
    render.line(basis + k * dev, "+" + str.of(k), color = color.hsv(k * 40, 75, 95))
    render.line(basis - k * dev, "-" + str.of(k), color = color.hsv(k * 40, 75, 95), stroke = style.dotted)
}analysis "Rainbow stochastic" { overlay = false }
for len in [9, 14, 21, 34, 55] {
(k, d) = ta.stoch(close, high, low, len, 3, 3)
render.line(k, "%K " + str.of(len), color = color.hsv((len - 9) * 5.5, 70, 95), width = 1.5)
}
render.level(80, "80", color = color.slate.600, stroke = style.dashed)
render.level(20, "20", color = color.slate.600, stroke = style.dashed)Palette families as a rainbow
Using the named shades instead of color.hsv keeps the colors consistent with the rest of the terminal's theme:
analysis "Family rainbow" { overlay = true }

render.line(ta.ema(close, 8), "8", color = color.red.400)
render.line(ta.ema(close, 13), "13", color = color.orange.400)
render.line(ta.ema(close, 21), "21", color = color.amber.400)
render.line(ta.ema(close, 34), "34", color = color.lime.400)
render.line(ta.ema(close, 55), "55", color = color.emerald.400)
render.line(ta.ema(close, 89), "89", color = color.cyan.400)
render.line(ta.ema(close, 144), "144", color = color.blue.400)
render.line(ta.ema(close, 233), "233", color = color.violet.400)Readable text
color.readable(bg) picks black or white text for a background, and color.contrast(a, b) gives the WCAG ratio (4.5 or more is comfortable for small text). Use them for table cells whose background follows the data:
analysis "Readable cells" { overlay = true }

r = ta.rsi(close, 14)
bg = color.gradient(r, 20, 80, color.sky.300, color.rose.700)
persist t = draw.table.create(anchor.top_right, 1, 2)
if bar.is_last {
    draw.table.cell(t, 0, 0, "RSI", text_color = color.slate.400)
    draw.table.cell(t, 0, 1, str.format("{:.1f}", r), bg_color = bg, text_color = color.readable(bg))
}
render.candle_color(bg)Colors as parameters
param.color lets the user pick a color in the settings dialog; the value is a normal color.
analysis "Configurable colors" { overlay = true }

up = param.color(color.emerald.400, title = "Up color")
dn = param.color(color.rose.400, title = "Down color")
fade = param.int(90, title = "Background transparency", min = 0, max = 100)
f = ta.ema(close, 10)
s = ta.ema(close, 30)
render.line(f, "Fast", color = f > s ? up : dn, width = 2)
render.line(s, "Slow", color = color.slate.400)
render.background(color.translucent(f > s ? up : dn, fade))A band's fill color is part of the chart layout and must be a constant; per-bar colors work on lines, histograms, dots, marks, candles and backgrounds.